Debugging is the process of identifying and correcting programming errors. It is known in English as debugging, which is similar to the elimination of bugs, the informal name for programming errors. The term bug is said to come from the era of thermionic valve computers , in which problems were generated by insects that were attracted to lights and damaged the equipment.
In this article we will see how to find “bugs” in our PHP code and with the arrival of Drupal 8 I would highly recommend its use, due to the amount of data that the objects themselves carry, and that by doing a var_dump() it would be almost impossible to understand in the browser.
1. Instalar Xdebug:
First we will have to create a file, I will put phpinfo.php with the following code:
We locate it in the root of our server and access it in our browser, in my case it would be: http://localhost/phpinfo.php
We would see something like this:
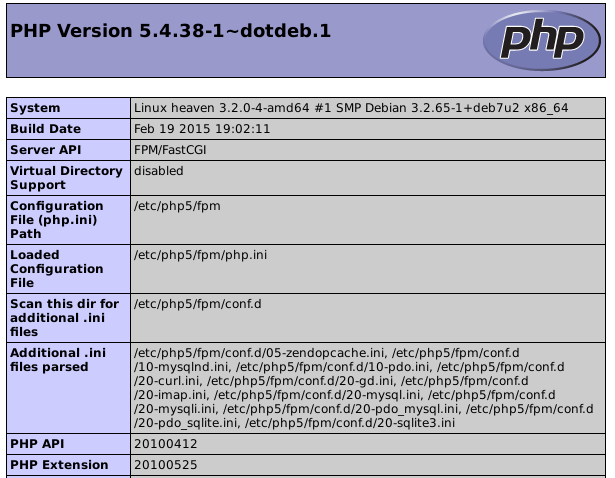
We mark all the content and copy it:
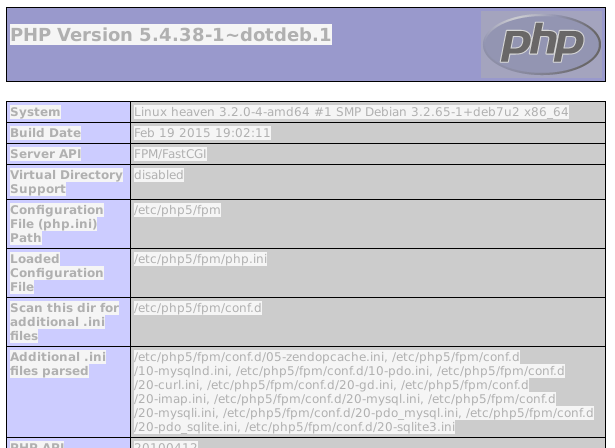
We go to http://xdebug.org/wizard.php where we paste it and click on the “Analyse my phpinfo() output” button:

Below the site will show you the steps to install Xdebug on your Operating System.
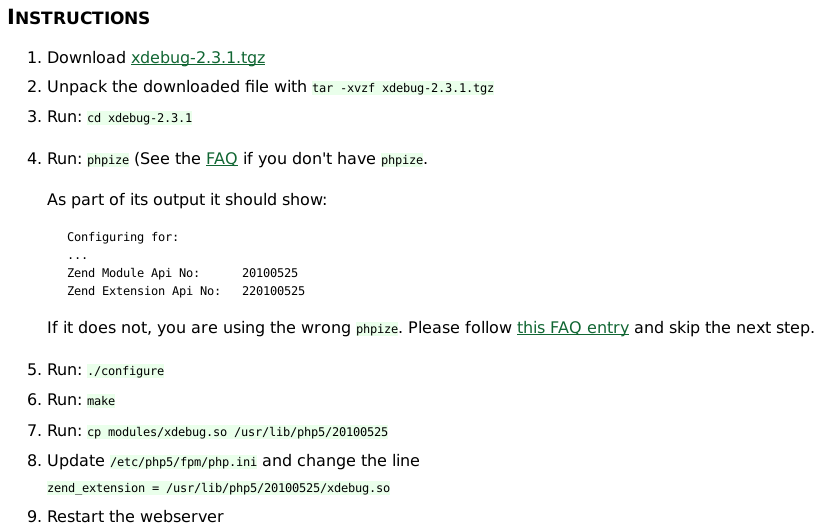
In the step where the extension is activated in your php.ini file, also add the following lines:
xdebug.remote_enable=1
xdebug.remote_host=127.0.0.1
xdebug.remote_port=9000
xdebug.idekey=PHPSTORM
xdebug.max_nesting_level=500
As shown in the following image:

2. Add the PHPStorm bookmarklet to our browser:
We need to go to http://www.jetbrains.com/phpstorm/marklets/ and click on the “Generate” button
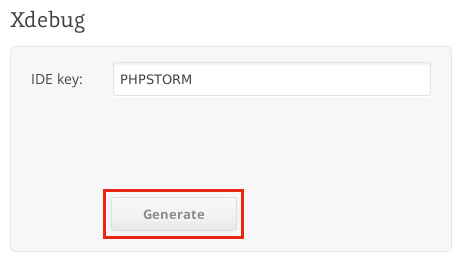
Below we will have the links available:
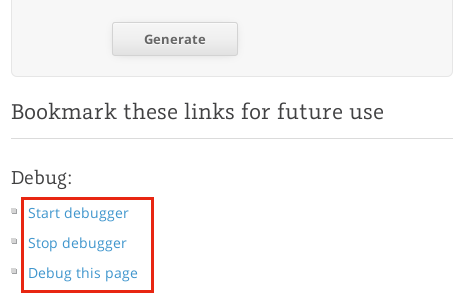
We should add them to our favorites, because we will use them every time we go to debug, just drag it to our favorites bar
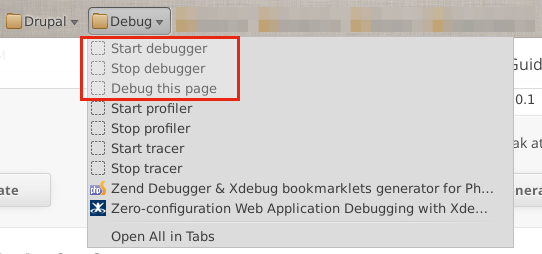
3. Let's try it!
We navigate to a page made in PHP. We add a breakpoint in PHPStorm by left-clicking on the column between the line numbers and the code:

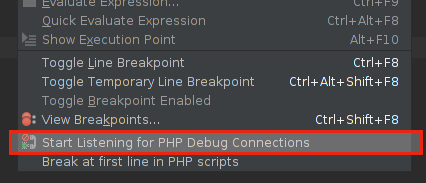
We press the button that looks like a telephone

Or in the Run menu → Start Listening for PHP Debug Connections
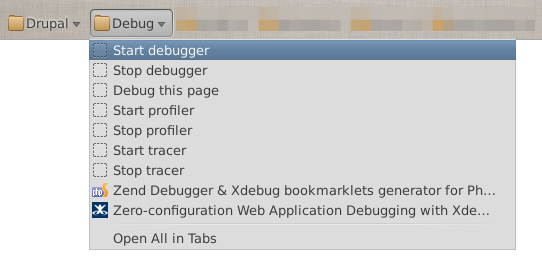
Let’s go to the browser. Click on our “Start Debugger” bookmark and refresh the page.
PHPStorm should display a window, asking for permission to start debugging:
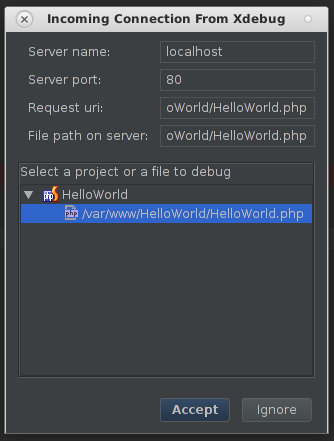
By accepting, we can begin to execute our code step by step.
Debugging tools window:

-
Debugging toolbar , in which we can skip all breakpoints, stop or continue the execution of our code.
-
In the Frames panel , we will have access to the successive calls that have been made until reaching our breakpoint.
-
The Variables panel shows all the variables available in our scope up to where our application is stopped.
-
The Watches panel , here you can include your most important variables and monitor them.
-
The Console tab will display system information, error messages, and data input and output for our application.
To debug our code, we have the following options:
 (Show Execution Point) Clicking on this button shows us at what point our application is stopped.
 (Step Over) By clicking this button we can debug line by line.
 (Step Into) Clicking this button causes us to debug inside the functions we call. For example:

By doing Step into in the previous line we can debug inside the square function and in the sum function. If there are several functions, as is the case and we only want to enter a specific one, we must use Run → Smart Step Into:

Here we specify that we want to enter only the sum function.
 (Force Step Into) By clicking on this button we force the debugger to enter functions that normally the “Step Into” would not enter, such as External Libraries, Constructors, etc.
 (Step Out) Clicking this button causes the debugger to exit the current function and move to the line that follows before it was called.
 (Run to Cursor) When you click this button, the debugging program advances to the cursor, this occurs without the need to use a breakpoint.
 (Evaluate Expression) Clicking this button can calculate the value of an expression while debugging.
As you can see in our code we use a foreach, you may wonder how to evaluate a variable only when a certain condition is met, for example when $number == 7, normally we should use “Step over” again and again and stop to be evaluated when said condition is met. PHPStorm has a feature called conditional breakpoints, which when a condition is met stops the execution of the application. To create one, just right click on one already created and add our condition:
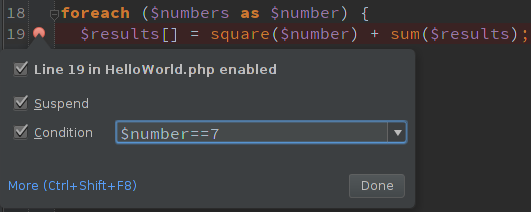
So when the condition is met, the script execution will stop at that point.
Well, I hope this article has been useful to you and helps you develop and be more productive in PHP.
