Before starting, it should be noted that the following tutorial is made on a system with the following characteristics:
- Servidor: Nginx
- PHP: 7.4 fpm
- SO: Linux Ubuntu 20.4
Not being more... Let's get started!
When you are developing new functionalities or adjusting or improving the current ones, you need to know what data the variables are going to be filled with at the time of code execution. In the case of PHP, there are several ways to do it. , using native methods such as: var_dump(), echo, print_r() or if you are going for something more elaborate and beautiful, in the case of Drupal use the devel module together with the kint library as a complement.
But these methods bring with them the dependency of a module such as devel for Drupal or, problems with readability of the information. To solve these problems, the solution is at hand:
Xdebug & VSCode
On this occasion we will learn how to configure Xdebug together with Visual Studio Code or VSCode
- Xdebug
- VS Code - PHP Debug
- VS Code - launch.json
- Xdebug in action
Xdebug
First of all, you must make sure you have Xdebug installed and to do this we go to the Xdebug Wizard and follow the steps specified there; Xdebug will ask us to paste the result of executing the php -i command into the text box, but in our opinion it is more efficient to open the phpInfo page on our server and copy all its contents into the same text box:
Tip: with the Ctrl+a or Cmd+a key shortcut we can select all the content of the page.
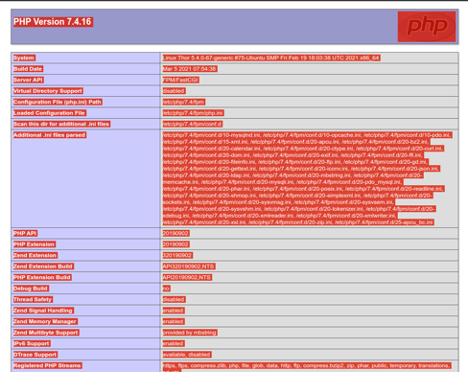
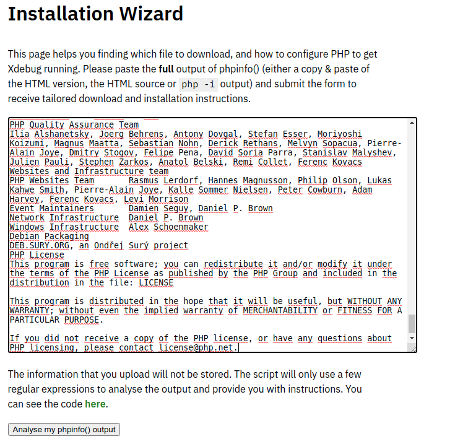
Once Xdebug is installed as indicated on the official site, it is time to install the extension for php, in this case you have version 7.4 of php:
sudo apt install php7.4-Xdebug
We can verify it by running the command: php -v

Done! For now. We still have the task of configuring VSCode and for them let's continue.
VS Code - PHP Debug
It should be noted that for this point you must have VSCode installed and if not, download VSCode from here .
We'll go to VS Code and install the PHP Debug extension .

Here you also have a quick guide on how to install and configure Xdebug.
Now and according to the extension instructions you will have to go to the php.ini file corresponding to the current version and activate Xdebug by adding the following lines:
zend_extension = /usr/lib/php/20190902/xdebug.so
xdebug.mode = debug
xdebug.start_with_request = yes
xdebug.client_port = 9000
(The path to the xdebug.so file was obtained from the instructions that xdebug gave us at the time of its installation.)

VS Code - launch.json
The final step is to set up a launch.json file for the workspace or project:
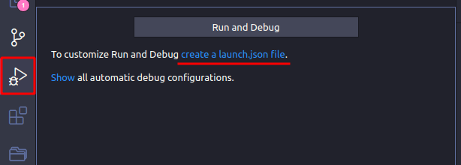
In the RUN AND DEBUG section, click on the create a launch.json file link, select the workspace and then PHP, paste the following configuration into the file that was created within .vscode/launch.json in the root of the project.
{
"version": "0.2.0",
"configurations": [
{
"name": "Listen for XDebug",
"type": "php",
"request": "launch",
"port": 9000,
"pathMappings": {
"/path/to/drupal/webroot": "${workspaceFolder:webroot}"
},
"xdebugSettings": {
"show_hidden": 1
}
}
]
}
/path/to/drupal/webroot is replaced by the path to the root folder of the project, and webroot by the name of its folder, in this case it would look like this:
"pathMappings": {
“/usr/share/nginx/html/raiz/atomic”: "${workspaceFolder:atomic}"
},
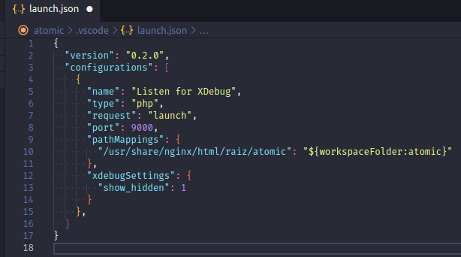
Now, ready to debug!
Xdebug in action
It's time to do a little test within Drupal! In this case we must debug the libraries that are loaded on a specific page and along with this the current route we are on, for this we will use the hook_page_attachements() which returns the information of these libraries in its parameter $attachments .

It is started by placing a breakpoint on some line and pressing F5 to make XDebug start listening.

Now the page must be reloaded to restart the execution of php and for XDebug to capture each variable in the execution process.

XDebug will stay at a certain point of execution until it is told to continue to the next line, at which point the value held by the $attachments variable has been captured but $currentPath is still empty but initialized.
At the top you will have the controls to tell XDebug to go to the next line, continue execution or stop it.

By pressing the previous button, XDebug has been told to go to the next line and thus know the value of our $currentPath variable.

At last!
Conclusion
We have learned to configure XDebug and VSCode to inspect our code at runtime and thus avoid depending on extra modules or boring methods, which will make the processes more efficient and productive, apart from the fact that the information appears in our opinion very organized and readable.
